Reversing coolprogram.exe, Flare-on Challenge 12 Part 1
For this challenge we were given an executable coolprogram.exe, and a network capture of suspicious traffic. I was not able to finish this one during the competition, so I have been working on it to learn more about reversing. The farthest I got was to pull the encrypted secondstage from the pcap, and to see coolprogram.exe call out to a suspicious URL. I was also able to learn that coolprogram checks the registry for different keys, and was written in Delphi.
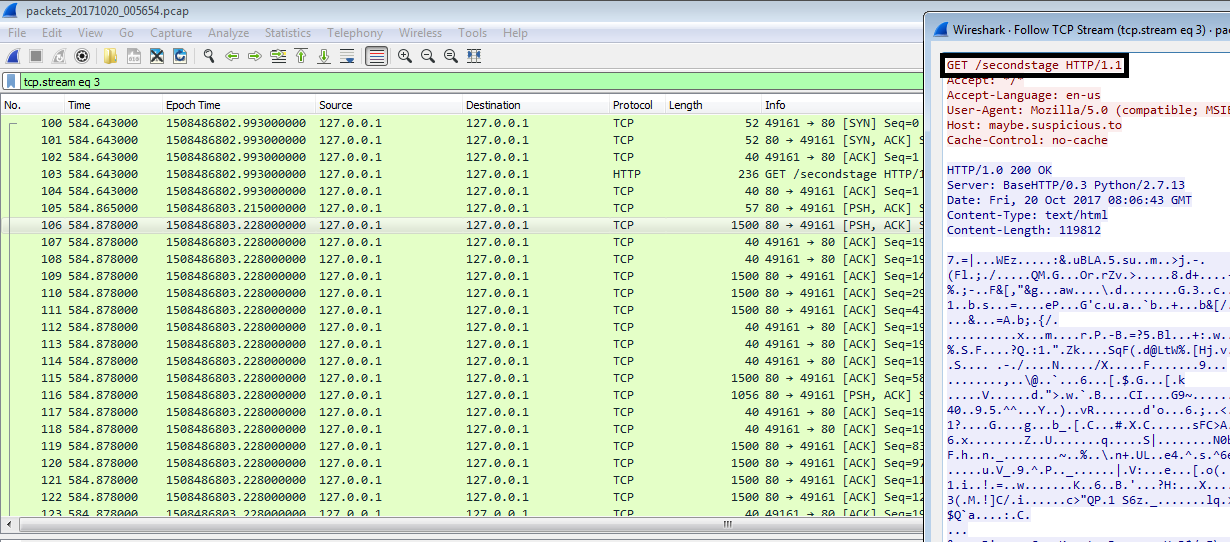
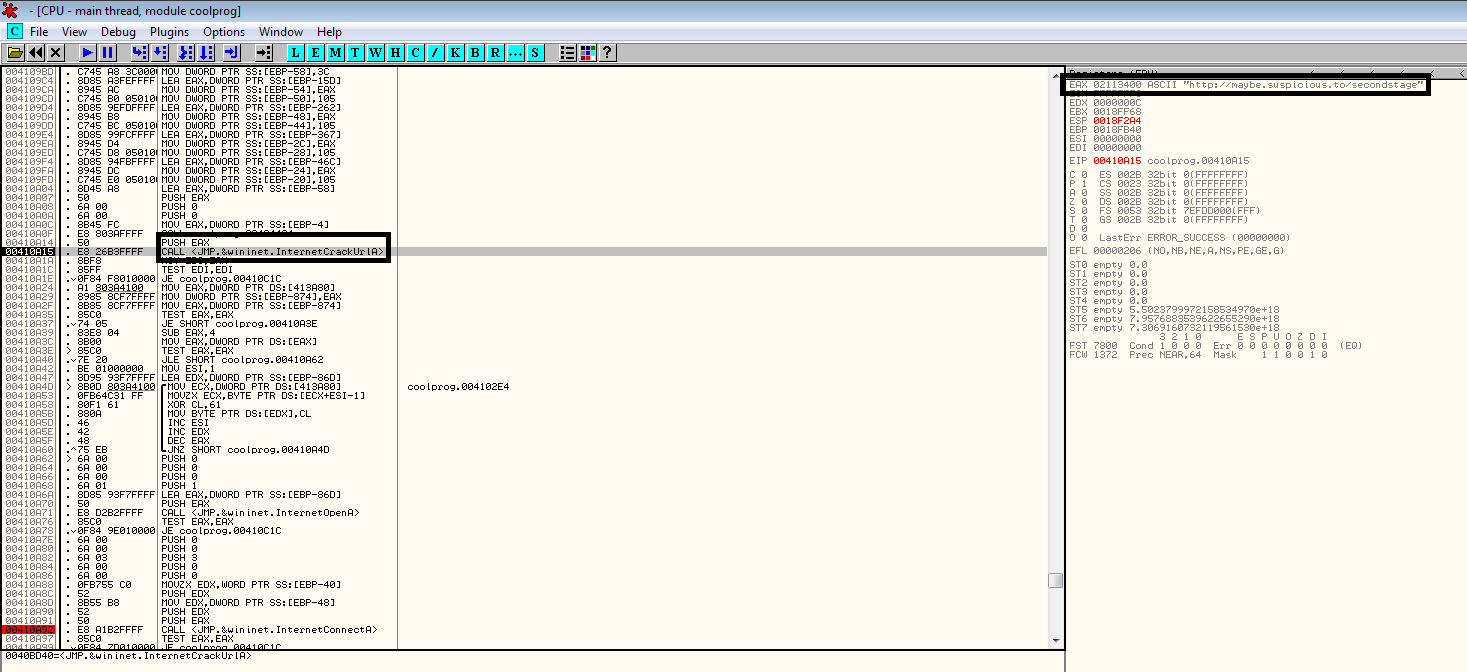
Below is the executable running in OllyDbg, it is connecting to http://maybe.suspicious.to and is going to make a GET request for the file secondstage. This is the file recovered from the pcap.
Someone gave me guidance that I needed to serve the secondstage to the program, so it can decrypt it. After doing research I learned that FireEye made a program to fake network traffic called FakeNet-NG. This program is really easy to use and can be configured to do many different things. Besides handling different network traffic, it provides the ability to execute commands when it gets the web traffic. This can then be used to attach a debugger or dump memory. I was not able to do this, but I was able to get it to respond to coolprogram’s GET request.

FakeNet-NG provides default files to send to a program when it gets requests, but you can also send your own. The request is handled by looking into the file folder for that file, if it doesn’t find the file it will return its default file.
![]()
After the program receives the file it will decrypt it and use it. You can now see another process (iexplore.exe) sending out a request for a suspicious URL. This process was not there before, so it is probably related to coolprogram.exe. I wasn’t sure what to do from here so I looked over the beginning of the solution provided by FireEye. They said that coolprogram starts internet explorer and then does what is called process hollowing. This is the process of carving out memory in the process, and then transferring code into memory to then execute. One way this is done is through the WriteProcessMemory API call. (Trustwave Processes Hollowing)

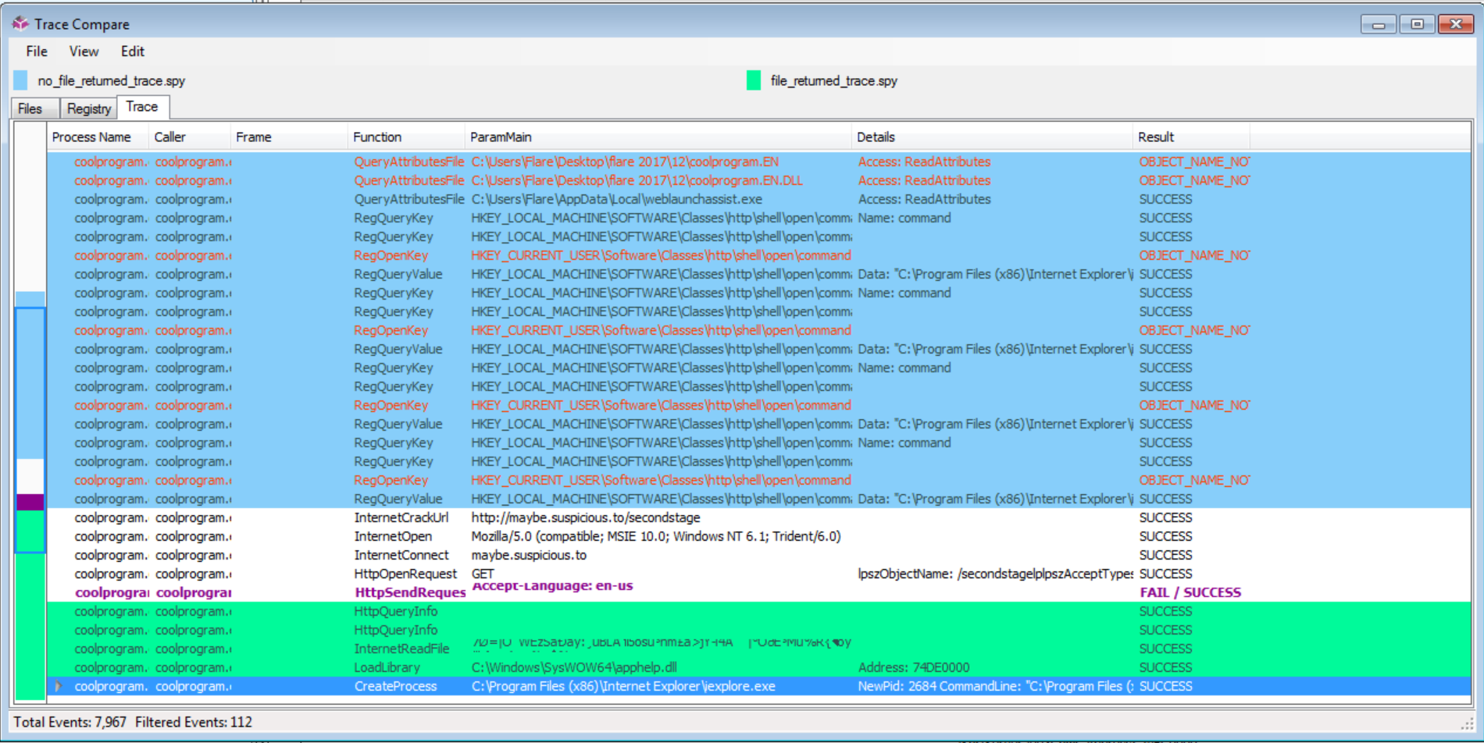
I used Spy Studio to watch API calls made by coolprogram. Here you can see the calls for InternetCrackUrl, InternetOpen, InternetConnect, and HttpOpenRequest. This time I didn’t send the file back, so you can see the HttpOpenRequest failed.
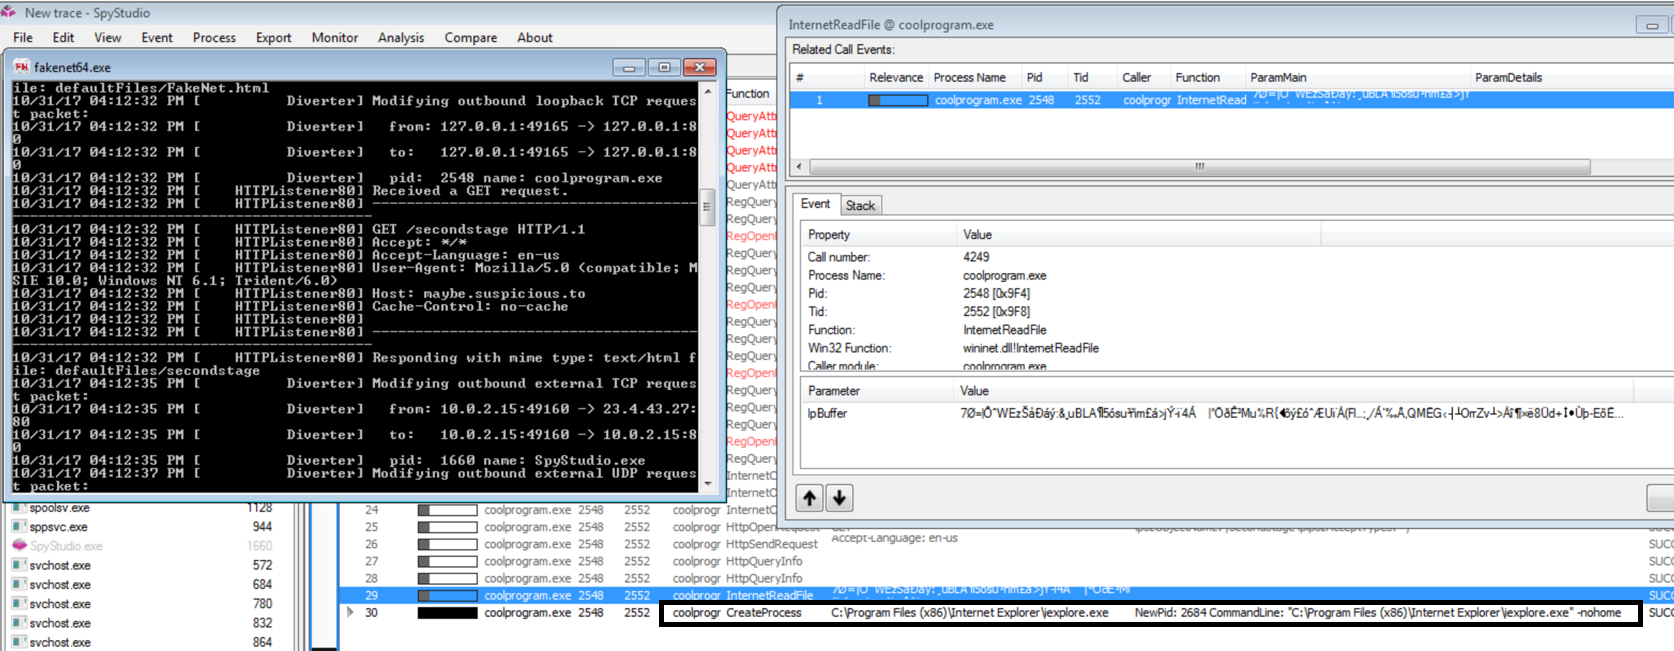
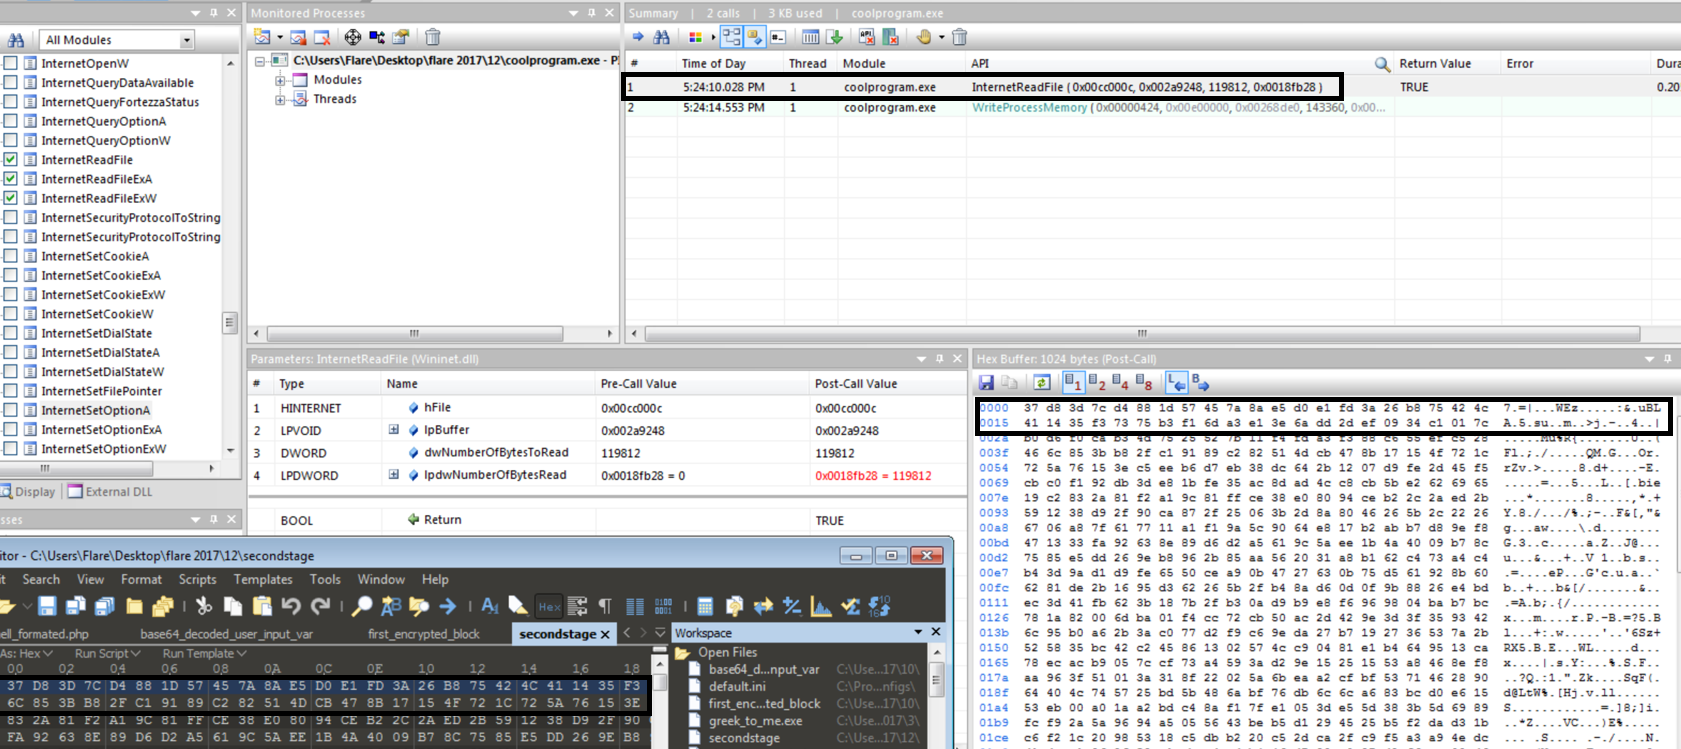
I then start up FakeNet-NG and rerun coolprogram, and this time it succeeds. Inspecting the InternetReadFile call allows us to see the parameters, and by breaking after the call we can see what was opened. In this case it was the encrypted secondstage that we had setup to be returned.
Coolprogram created a process with the command parameter of “C:\Program Files (x86)\Internet Explorer\iexplore.exe -nohome”. This proves that the iexplore.exe process we saw eariler was indeed a bad process started by coolprogram.
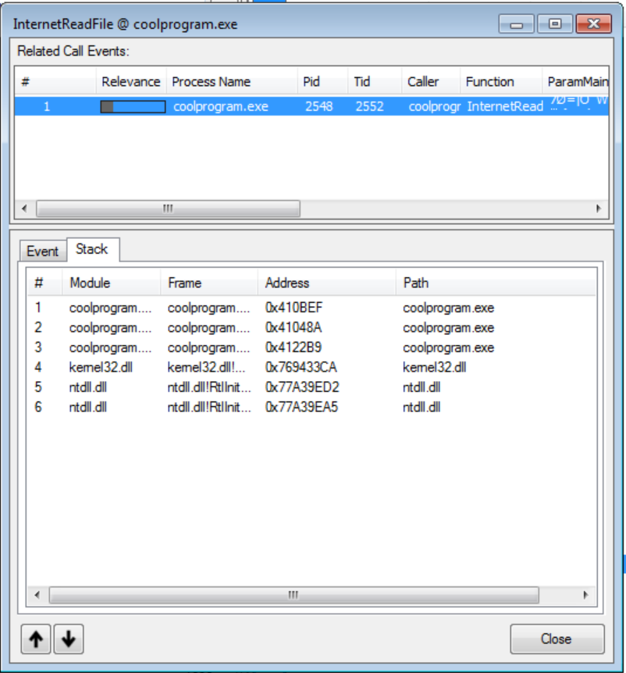
Spy Studio can show us the call stack when an API call is made. This can be useful to set breakpoints in a debugger or for finding a focus area for disassembly. Another nice feature of Spy Studio is being able to compare traces of the execution of a program. Below is the return from comparing the traces of coolprogram when no file was returned and when one was. It is currently filtered on “caller = coolprogram.exe”. This allows you to quickly see what was different when the file was returned.
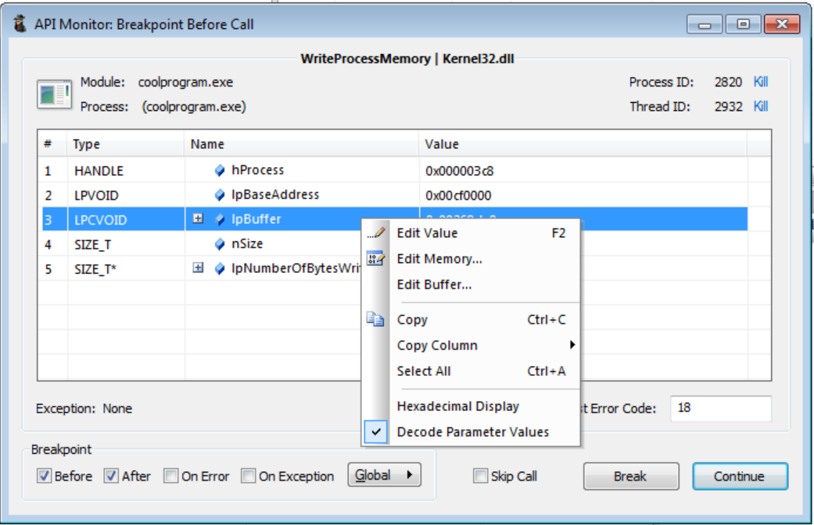
I was not able to find the API call for WriteProcessMemory in Spy Studio, so I fired up API Monitor. InternetReadFile and WriteProcessMemory API calls were selected to monitor. This is another way to see the different calls the program makes, but you need to know what API calls you want to monitor. Breakpoints can be set to before or after an API call. This allows you to attach a debugger to the process or even modify the values being passed to or returned from the API call.
Below I inspected the call to InternetReadFile to check that the file retrieved by coolprogram was the one I wanted it to grab.
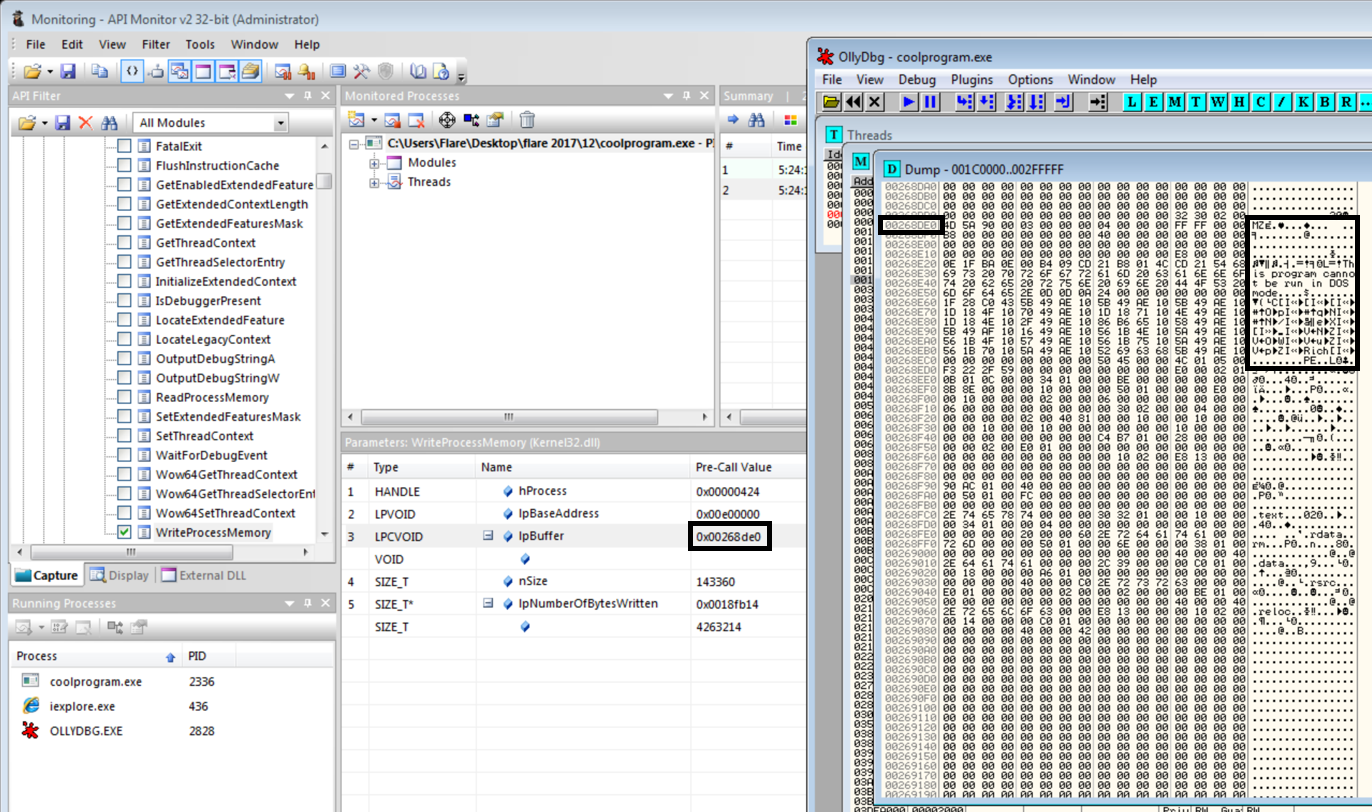
By breaking on the WriteProcessMemory API call the parameters passed can be inspected. The parameters we are interested in are IpBuffer and nSize, which is the address of memory to start writing from and number of bytes to write respectively.
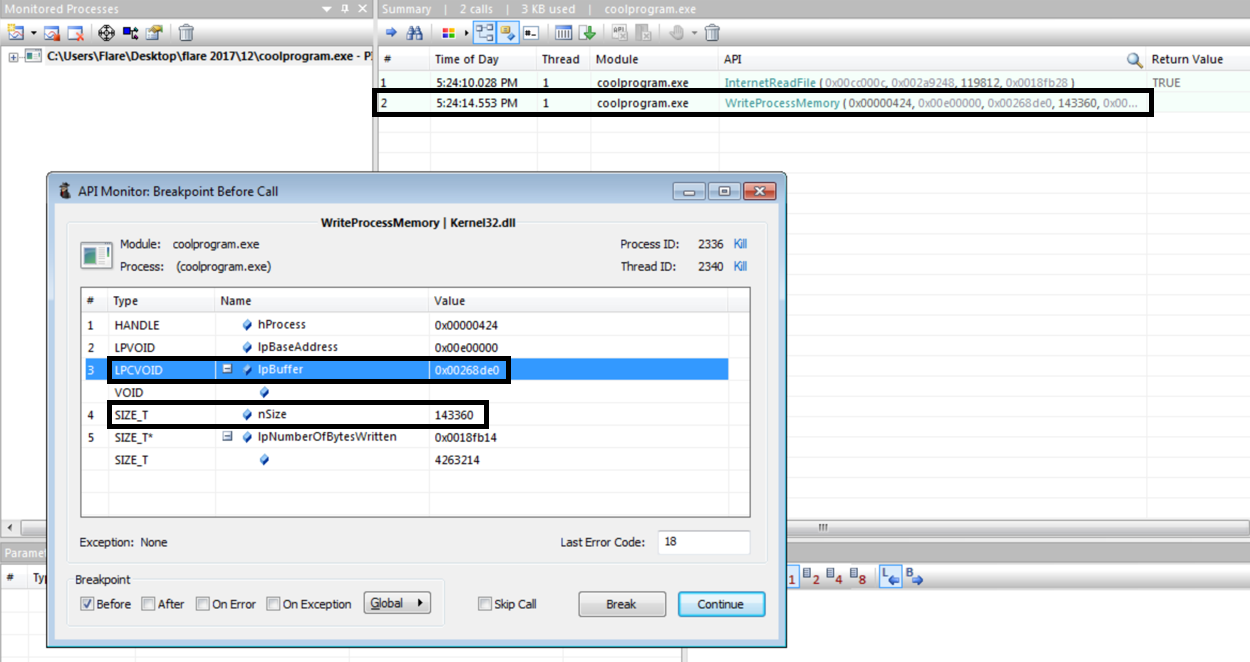
The memory can be dumped many different ways such as using procdump, ollydbg, or using Api Monitor to inspect the memory. Now we have the decrypted secondstage and are now able to go to the next step.
This challenge was made to resemble something you might find in the real world. I enjoyed learning new tools and new ways to use them in order to complete the first stage. I will upload a part two, once I have completed the second stage.
